
In this article, we will go over the Performance Reports section of the Reports Dashboard in HoudiniEsq 2.0. This is a quick, concise section which will allow you to easily see in graphical representation the current performance and income forecasts for your firm or organization.
The Performance section is comprised of 3 individual reports.
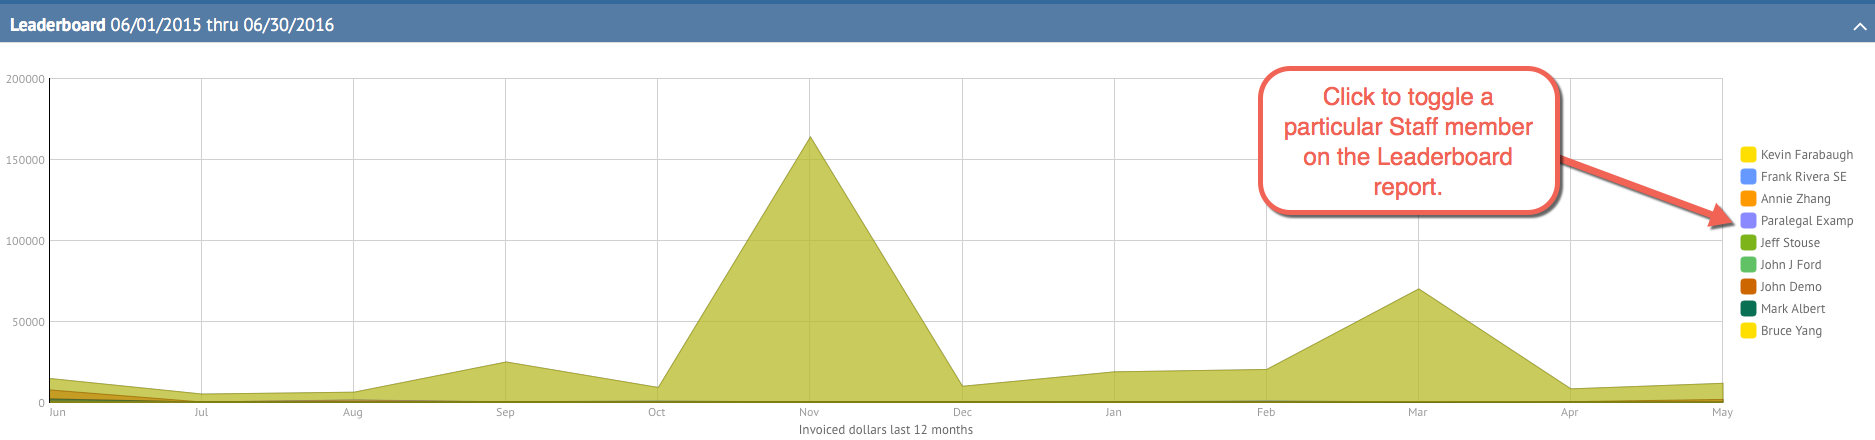
The first is the Leaderboard. This graph shows the billable item performance of each Staff member over the last year. You can toggle a particular Staff member’s contribution to the chart by clicking any of the buttons to the right of the chart. Additionally, the ^ arrow will allow you to collapse this section at any time.
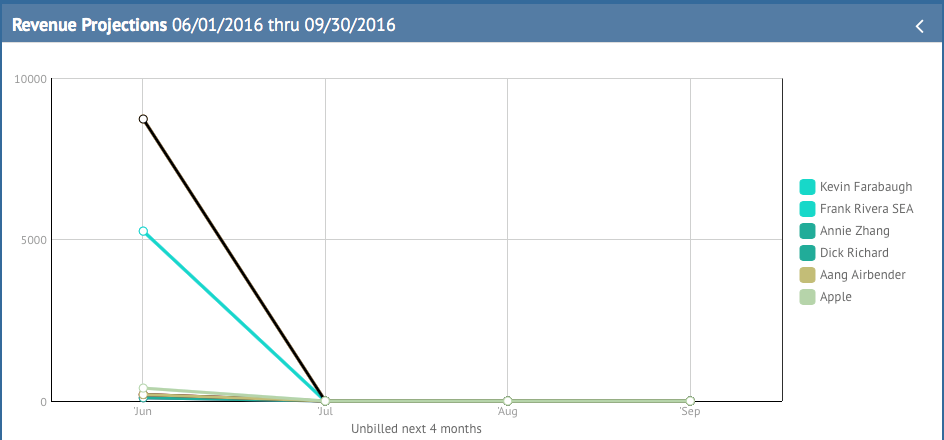
The second is the Revenue Projections. This report will show all billable time recorded for each Staff member for the next 4 months which has yet to be added to an invoiced (or “billed”). This will allow you to accurately project your income based on billable Events in the system. As with the Leaderboard, you can toggle a particular Staff member’s contribution to this graph with the buttons on the right.
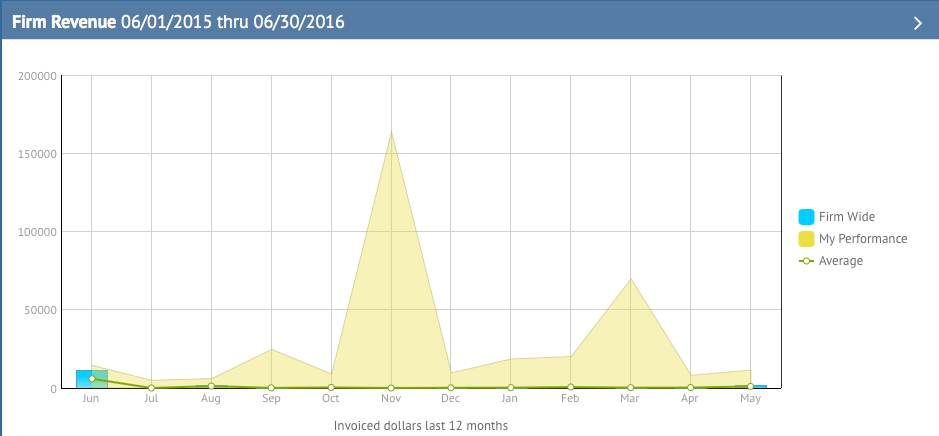
The last of the Performance reports is the Firm Revenue report. Where the Revenue Projections report shows projected revenue, this chart will show the actual revenue from the past 12 months. Additionally, it will compare your performance will the rest of the contribution from the firm, allowing you to see your overall impact.